July 2024 Market Snapshots
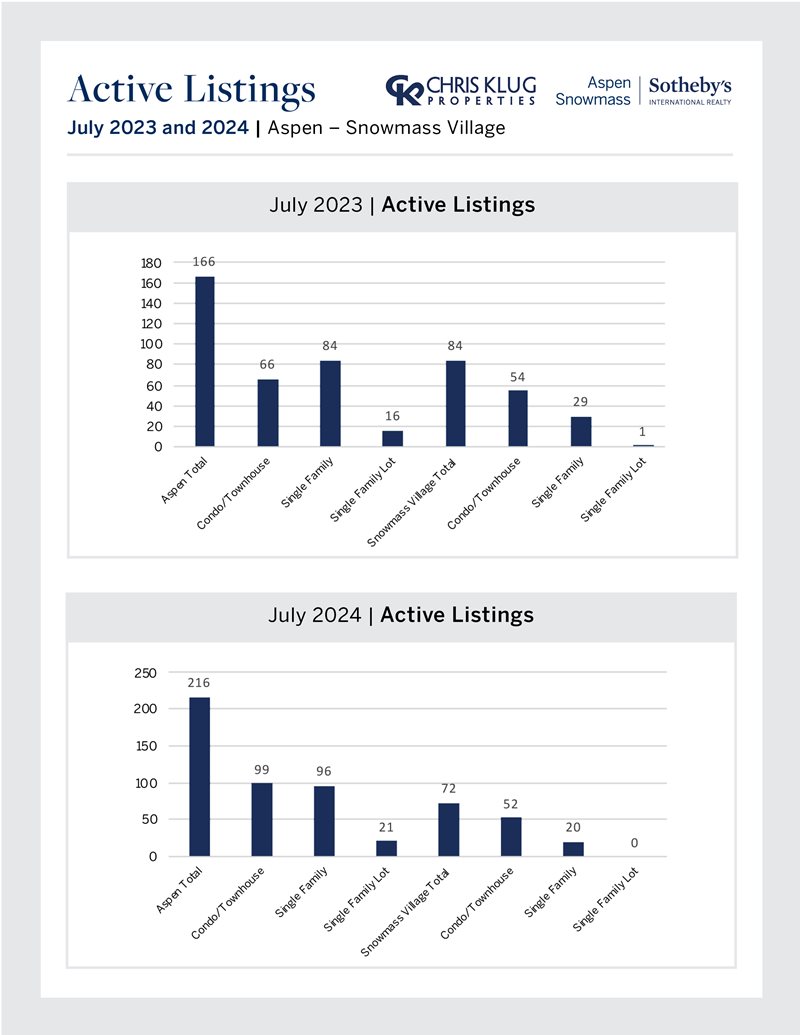
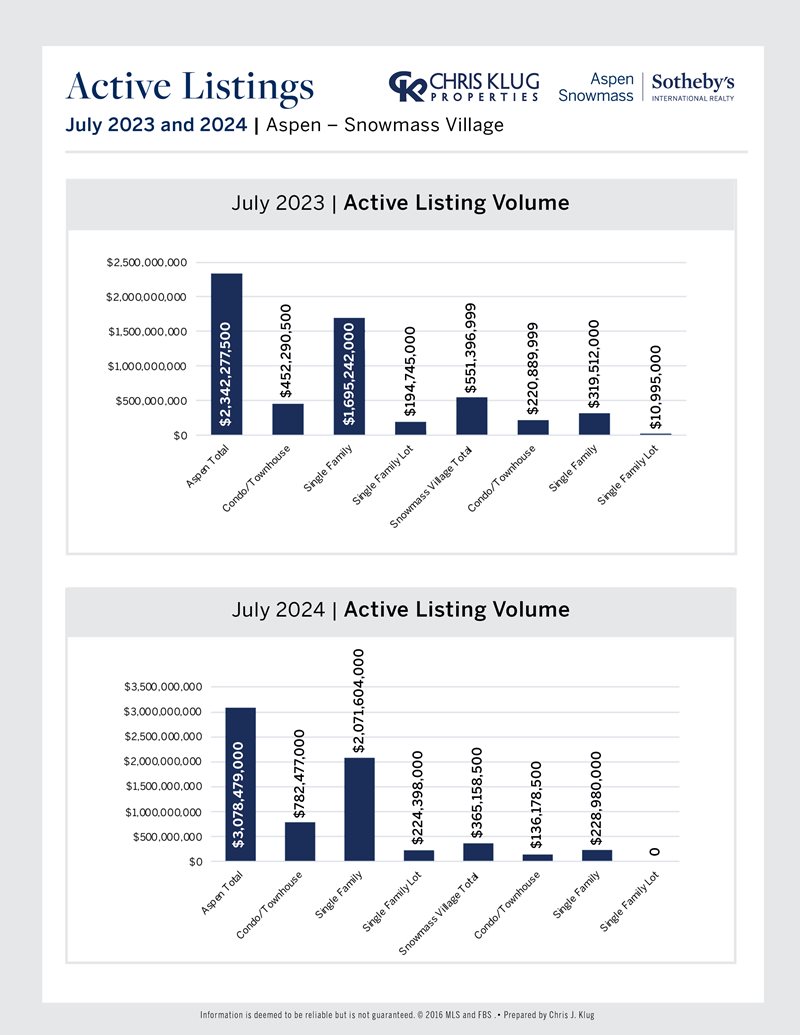
In Aspen Snowmass, a seller’s market remains, but not as extreme as the past years. There are more options for buyers, but the inventory levels are still historically low. Aspen’s inventory is increasing, while Snowmass Village’s inventory is declining. However, both areas still have lower inventory levels compared to historical averages.
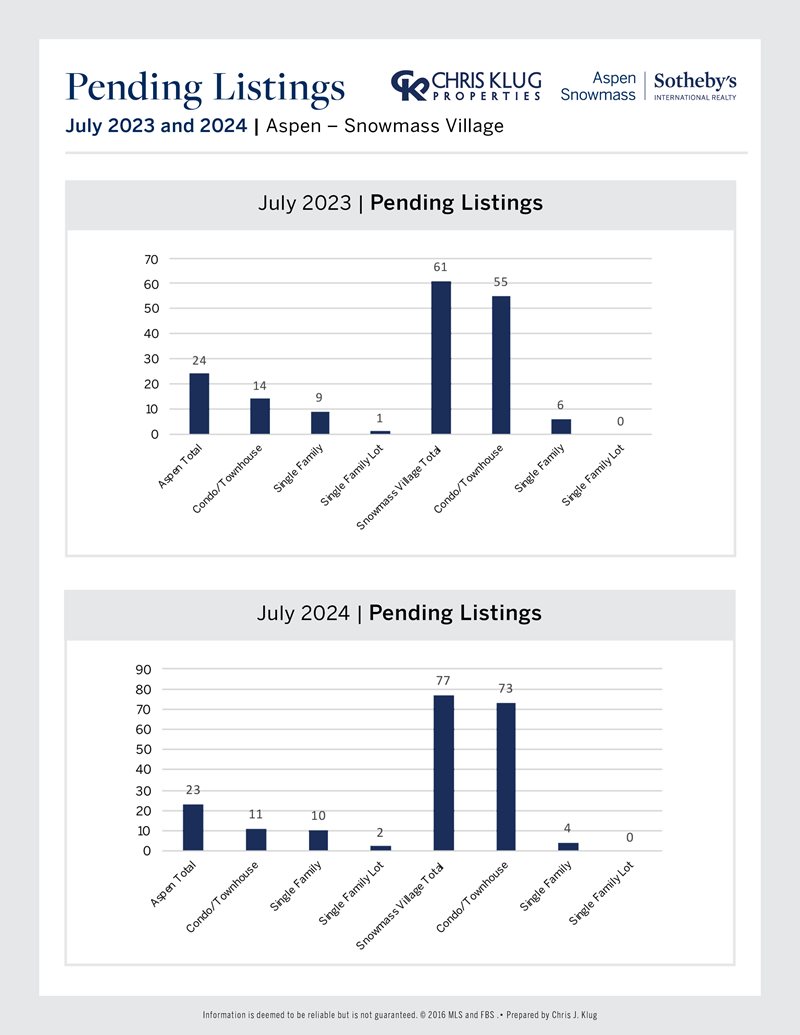
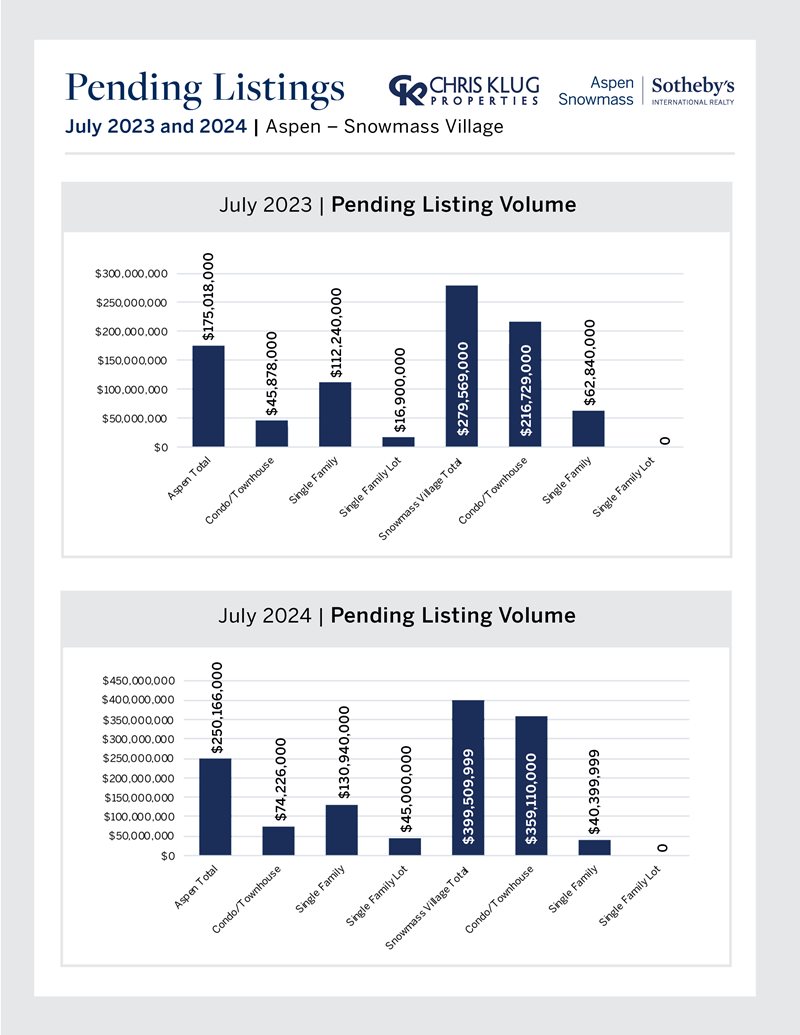
Pending sales and pending volume are stronger than a year ago, indicating a potentially strong second half of the year for closings if all deals go through due diligence. Prices in Aspen and Snowmass are also stronger than a year ago. It’s worth noting that if we exclude the three $50 million+ sales that closed in April 2024, the sold volume would be $129 million behind last year at this time, showing the significant impact of ultra-high-end sales on our market. The number of $10 million and $20 million+ sales is in line with last year. Buyers have more options and slightly more bargaining power today compared to previous years, as shown by lower sale-to-list ratios overall.
It’s not the right time for aspirational pricing strategies unless you have a truly unique property that can’t be replicated. The winning formula still involves pricing accurately, staging beautifully, marketing aggressively, and closely following market feedback and traffic. Please see 12 key insights below and our Aspen Snowmass market snapshots
1) Aspen inventory of all property types is up 30% from a year ago, and 66% from 2 years ago, but still down 26% from July 2019.
2) Snowmass Village inventory of all property types is down 14%, 13% from 2 years ago, and 66% from July 2019 pre-pandemic.
3) Aspen’s Pending Transactions of all property types are almost the same as last July with pending volume up 43%.
4) Snowmass Village’s Pending Transactions of all property types are up 26% with volume up the same as Aspen at 43%.
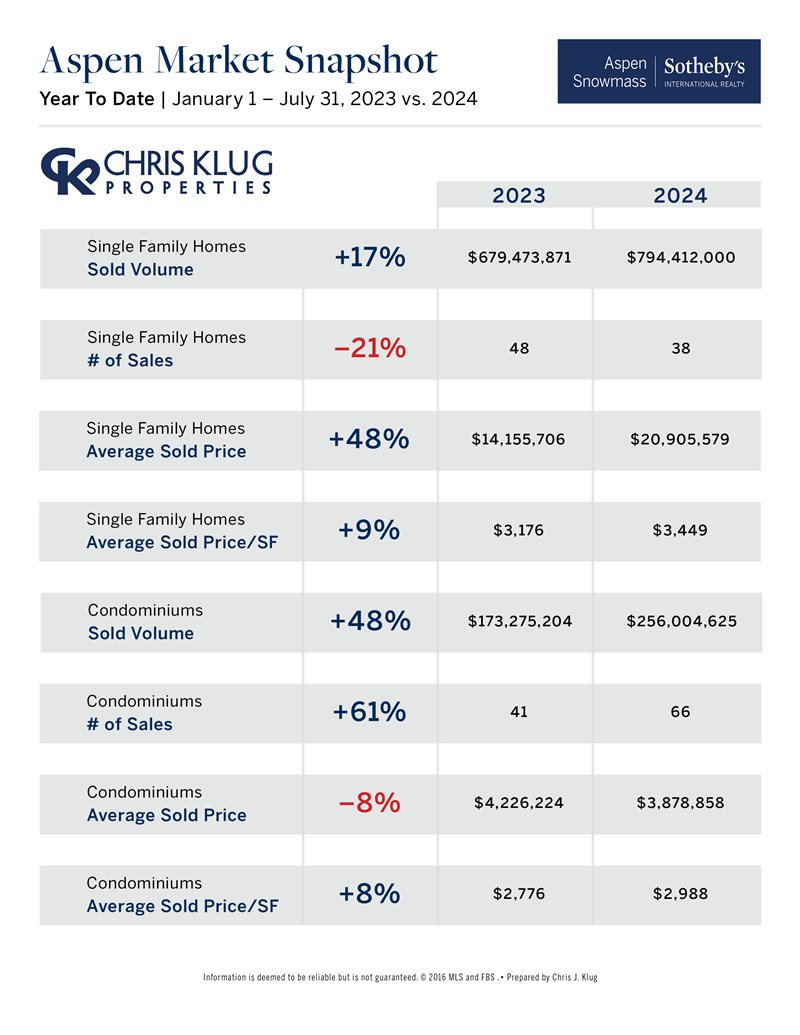
5) Aspen’s single-family sold volume is up, transactions are down about 21%, average sold price of $20.9 million is up 48% from $14.1 million a year ago. The average Aspen SF sold $/SF is $3,449 up 9% from a year ago.
6) Aspen condo’s sold volume is up almost 50%. # of sales from 44 last year to 66 this year 61% jump. The average Aspen condo sold price is down 8% at $3.8 million with Aspen condos sold $/SF up 8% from $2,776 to $2,988.
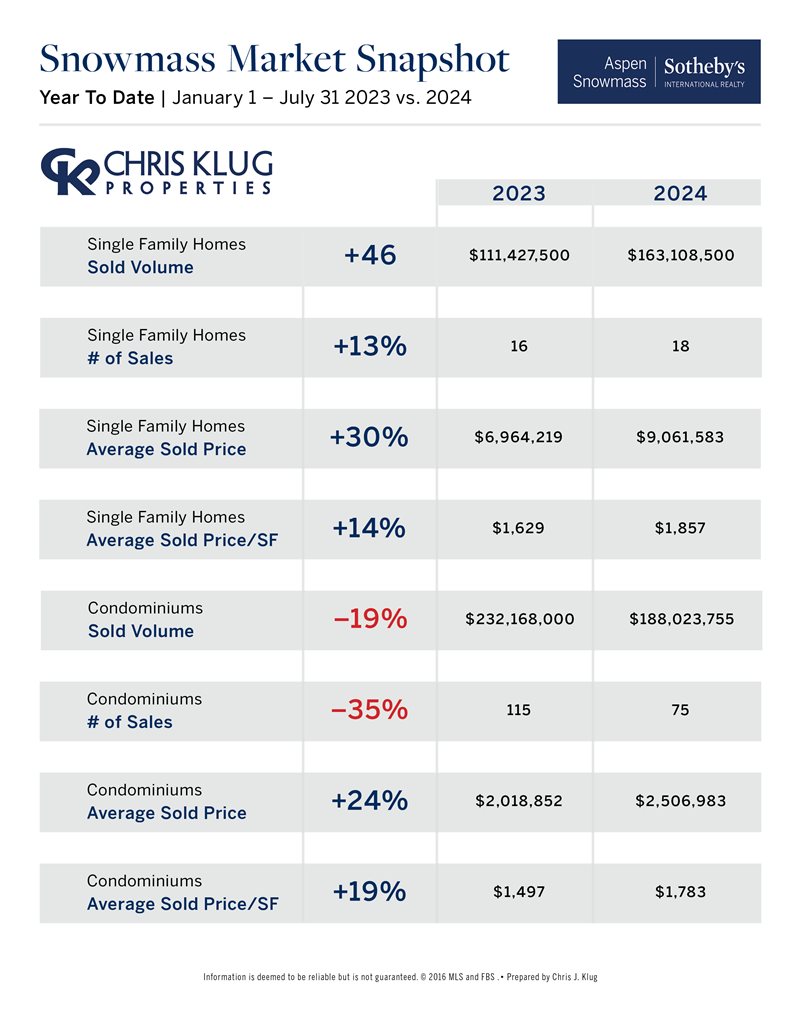
7) Snowmass Single-Family’s sold volume increased 46%, transactions are up 13%, the average sold price jumped 30%, and the average sold $/SF is up 14%.
8) Snowmass Condo’s sold volume decreased by 19%, transactions down 35%, but the average sold price increased by 24% as did the average sold $/SF by 19%.
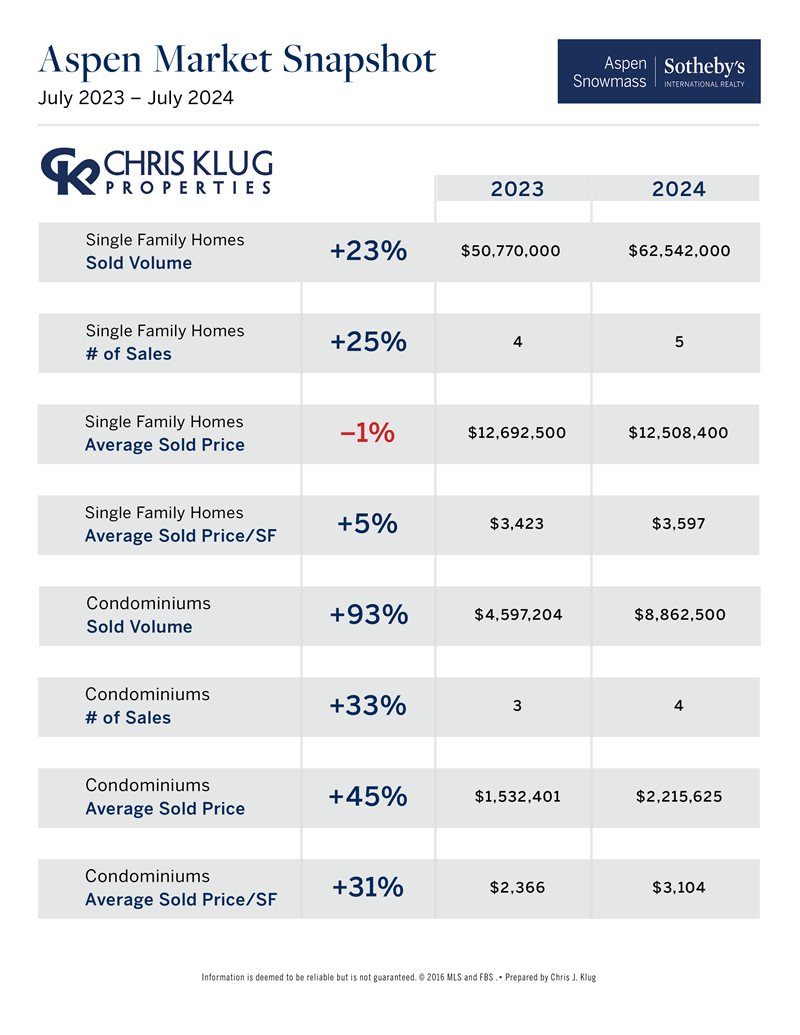
9) Aspen July 2024 vs. July 2023 instead of YTD, Aspen single-family in July 2024 was stronger with volume up 23%, transactions up 25%, the average sold price almost the same, and condo numbers even stronger.
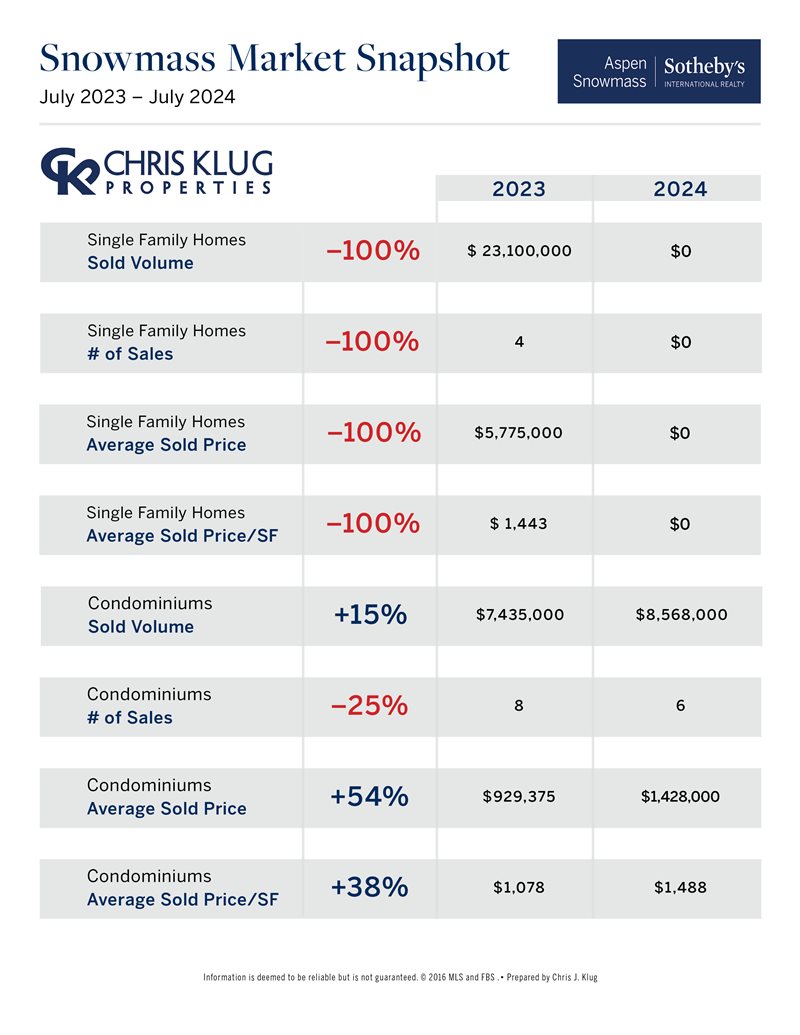
10) Snowmass Village July 2024 vs. July 2023 instead of YTD, there were no single-family sales in Snowmass Village in July 2024 due to Snowmass Village SF inventory down 31%. SMV Condo transactions were down 25%, but volume and pricing increased in July 2024.
11) 40 $10 million + Sales last year in Aspen Snowmass and 40 this year.
12) 14 $20 million + Sales last year in Aspen Snowmass and 14 this year!
